
The differences between digital and print reading strategies
Studies show people read digital and print versions of the same material in different ways. What does this mean for indie creators?

As I head once more unto the comic crowdfunding trenches, I’m again reminded of how much both comic creators and readers love the physical format, even when it comes to single issues.
I admit to becoming a bit of a print snob in recent years, and now worry constantly about the weight and finish of the paper stock in order to produce something of high quality that I know readers will love to hold in their hands.
It’s a similar thing with books. I love the weight and smell of a printed book in my hands. There’s something magical about it.

But I’m also acutely aware of print costs, and how they can quickly destroy the business model of an indie creator, which is why I also focus on crafting a high-quality DRM-free digital experience as a cost-effective alternative for backers.
I also struggle to find time to read physical books. Between the day job, family time, and writing time, there’s not much opportunity to sink into my favourite chair and read. More often than not, my reading time consists of me devouring an e-book in bed before falling asleep.
It’s fine. I never thought I would be able to adapt to it, but when push comes to shove, it’s not the worst way to read. But I do miss reading the printed version, and find myself skimming through e-books, and forcing myself to go back and read them.
As we all know, it’s a different reading experience.
But just how different is it?
I found a 2021 paper that looked into this question, not only by asking people to read a text and answer comprehension questions (which is a standard tool in this area of research) but also by measuring eye movements across the page.
The study
The study focused on comparing how print and digital readers responded to the same scientific text and images. There were nine images in the study, corresponding to one of four types which are associated with different cognitive responses:
Decorative e.g., a photograph, which takes little cognitive function to process.
Representational diagram, which takes more function because it is an abstract description of text.
Explanatory diagram, which shows a series of steps involved in performing an action.
Statistical diagram, which show relationships between variables.
The study also sought to understand if there were any differences between diagrams when read in print or digital formats.
64 undergraduate students were recruited for the study, with the text selected to be about slow earthquakes caused by typhoons. Because of the topic, students in geography and similar programs were ineligible to participate. Due to experimental difficulties, ultimately there was only data from 50 participants.
Participants were tested about their knowledge of the topic prior to the experiment, as part of the baseline.
They were randomized to either the print or digital group, and sat in the same chair (alone) to read the text. Upon completion, they were first tested on reading comprehension, which requires questions focused on free-recall, main-ideas, text retrieval, descriptions, and inference-generation. Responses were scored by two independent raters who needed to reach a specific level of agreement in how they interpreted responses.
The eye movement variables are defined below:
Total fixation duration = total time spent on an area of interest (defined in this study as text, diagrams, and diagram statements). Generally, the higher the fixation duration, the more intense the cognitive processing.
First pass fixation duration = total time spent on a first pass of the area of interest.
Re-reading fixation duration = total time spent on a repeat pass of already read material. Typically, this reflects deeper processing.
Number of rereading instances across pages = the number
of instances in which readers turned pages and made more than one eye movement between sections.
The comprehension test scores showed statistically significant differences between groups (ANOVA) with print readers scoring much higher than digital readers. An ANCOVA was also undertaken using total fixed duration, showing that article reading time affected comprehension scores, with the print group having significantly higher scores than the digital group.
The authors then used a two-way MANOVA (multiple analysis of variance) with eye movement measures as dependent variables, with reading modality and stage as independent variables. Print and digital readers spent the same amount of time reading the article, but where they spent their time was different.
Text
The analysis showed the digital group exhibited a large difference between the two reading stages (first pass and re-read) whereas the print group did not. Both groups had similar total fixation durations while reading the text sections in the first-pass stage; however, the print group spent more time reading text sections in the re-reading stage.
Diagrams
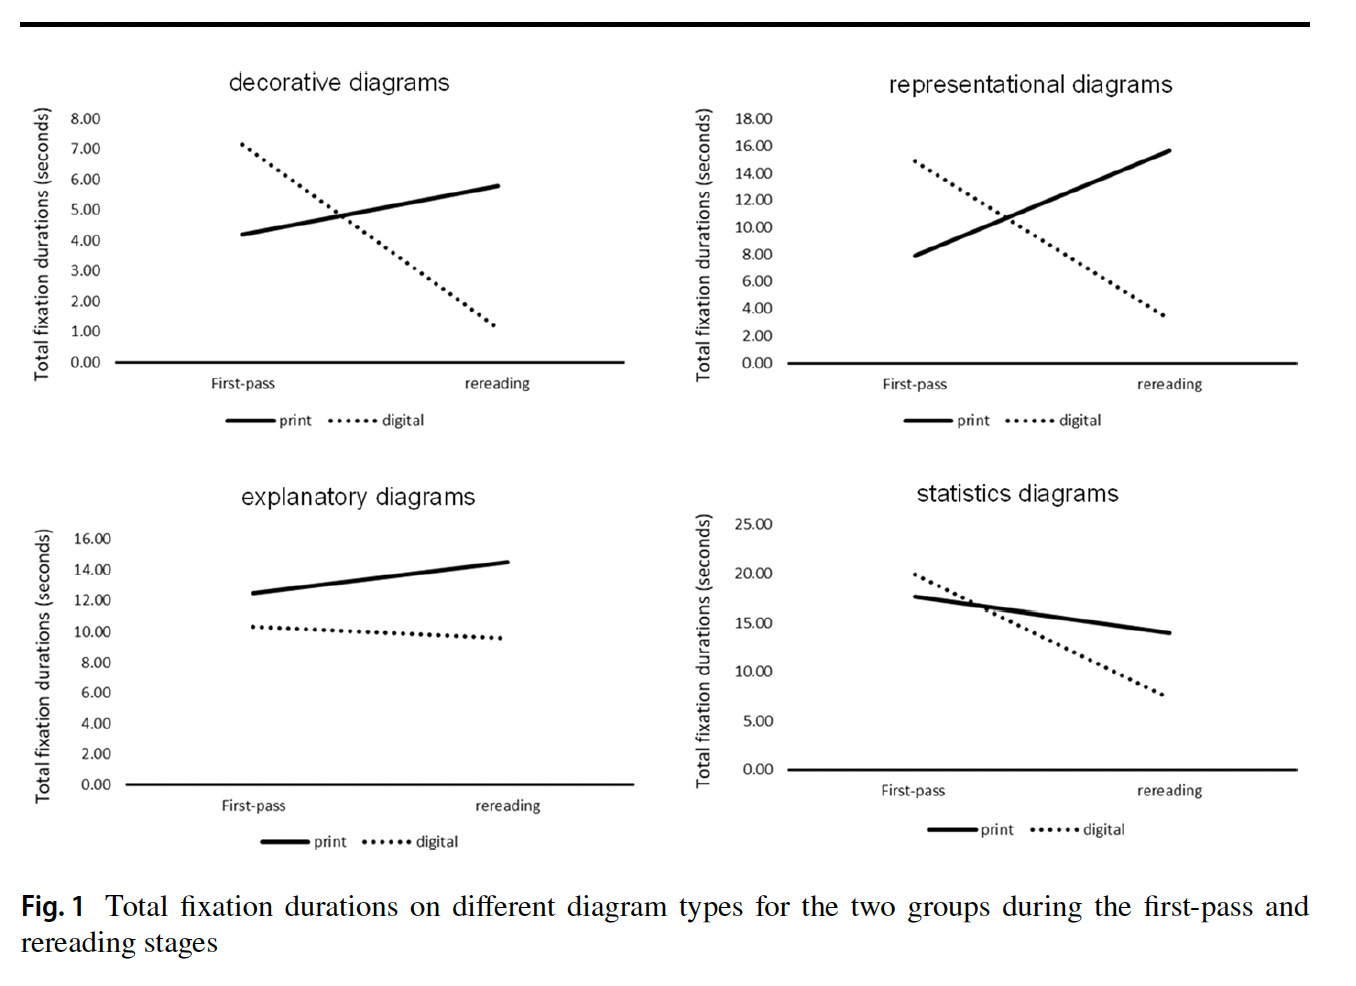
The digital group spent more time examining diagrams on the first-pass than on the rereading stage, whereas the opposite was true for the print group. In fact, the digital group typically spent more time in the first-pass stage for all diagram types, while the print group spent more time (at the statistically significant level) in the re-reading stage, especially for decorative and representational diagrams.
This behaviour is shown more clearly in the figures below (taken from the paper).
Finally, analysis further found that the print group had significantly more instances of re-reading across pages than the digital group.
The first conclusion from this study is that print readers have better comprehension of the material than those who read digitally.
Why is this the case? The authors postulate that this may be due to the theory of textual landscapes, suggesting the brain forms a better mental representation of printed text than digital text, allowing for better recall of information. However, they also suggest print may be less visually fatiguing than digital.
The second conclusion is that print and digital actually changes the way people read.
Digital readers typically read things once and then moved on, while print readers tended to re-read information (i.e., skimming first and then re-reading). This reflects more intentional and deeper processing amongst print readers, and that they adopt more flexible reading strategies, however the rationale was not well understood.
These findings resonate with me, as I know I often have to re-read printed text to either remember where I am in the story, or try to get a better understanding. While I could do this with e-books, I seldom seem to do so. Reflecting on my reading habits, I do tend to skim when I read digitally, and rarely ever go back to a previous page.
Part of this may be that I find it easier to do this with a physical book, as you can use a bookmark or finger to hold on the present page and then flip back to an earlier one. It’s not quite as easy to do this digitally, where you typically have to scroll or swipe back to an earlier page and then have to repeat the process to return.
What does this mean for creators?
This study dives into the different reading strategies exhibited by readers of print and digital, but not on the causal mechanisms behind the different strategies.
I think this is important for indie creators to think about, as there is clearly a difference between the physical and digital versions of the comics and books we create.
One caveat I think we need to understand though, is that the experiment here necessitated constraints on the digital readers to try and mimic the same conditions as the physical arm of the study. A key one was the inability of digital readers to enlarge the font size as they read. However, this constraint is actually an important one, because in the real world we often increase the size of the page (or the text in an e-book) to make it easier to read.
A reasonable question then, is whether comprehension and visual stimuli scores would actually be that different if the study leaned into the inherent differences of each format? I assume someone is working on this.
My takeaway though is that I need to think more carefully about how I create my digital products, so they are become more “sticky” for readers, and aren’t simply skimmed over in the rush to finish.
For comics, the interesting finding for me was that readers in both formats spent almost equal time on the explanatory images in the first-pass and re-read. Recall that these images are ones that show a series of steps in performing an action, and to my mind, are therefore the closest (of the four types) to panel layouts on the page.
The fact that digital readers didn’t skim and move on with these panels, suggests they spent time engaging with the narrative, i.e., they are more “sticky.” This was not true for decorative and representational images, where digital readers continued to skim read and seldom returned.
It suggests that comic panels need to be more than just decorative, in order to be effective. This goes to the heart of what makes for good comic storytelling, so isn’t necessarily anything new. But it does reinforce the need to know have throw-away panels or text in the digital comic, as that will reduce the likelihood of the reader skimming.
Was there anything here that surprised you? What are your key takeaways from this study?
Super fascinating! I'd love to see this study done specifically for comics.
Questions I have:
- What device(s) were used for the digital presentation? I wonder if there is a difference between reading on an iPad vs a computer screen.
- It looks like the performance metric was "stickiness." I wonder if, for non-academic reading of fiction, that is actually always a positive, especially for comfort readers.
Also, as an aside, based on my classroom experience, I anticipate this study will be used as evidence for removing tech from classrooms. This has a LOT of implications for a study with such a small sample size (and I assume it was conducted on the usual college-age cohort).
As always, thanks for bringing the cool stuff to the forefront!